Active Low-Carber Forums
Atkins diet and low carb discussion provided free for information only, not as medical advice.
Home Plans Tips Recipes Tools Stories Studies Products
Active Low-Carber Forums
A sugar-free zone


Welcome to the Active Low-Carber Forums.
Support for Atkins diet, Protein Power, Neanderthin (Paleo Diet), CAD/CALP, Dr. Bernstein Diabetes Solution and any other healthy low-carb diet or plan, all are welcome in our lowcarb community. Forget starvation and fad diets -- join the healthy eating crowd! You may register by clicking here, it's free!

Go Back   Active Low-Carber Forums > Main Low-Carb Diets Forums & Support > Low-Carb Studies & Research / Media Watch > Low-Carb War Zone
User Name
Password
FAQ Members Calendar Search Gallery My P.L.A.N. Survey


Reply
 
Thread Tools Display Modes
  #76   ^
Old Sat, Sep-10-16, 23:49
mushymindy's Avatar
mushymindy mushymindy is offline
Registered Member
Posts: 91
 
Plan: Low Carb My Way :)
Stats: 150/138/130 Female 5ft 4in
BF:
Progress: 60%
Location: Lake Macquarie, NSW, Aus
Default

Why was my post moved to the war zone? I didn't mean to cause any controversy, I just genuinely wanted some help

Reply With Quote
Sponsored Links
  #77   ^
Old Sun, Sep-11-16, 03:13
cotonpal's Avatar
cotonpal cotonpal is online now
Senior Member
Posts: 5,315
 
Plan: very low carb real food
Stats: 245/125/135 Female 62
BF:
Progress: 109%
Location: Vermont
Default

Quote:
Originally Posted by mushymindy
Why was my post moved to the war zone? I didn't mean to cause any controversy, I just genuinely wanted some help


My guess is that it had nothing to do with your original question. Unfortunately it is not a question with a simple answer that all would agree on so it turned into a debate on the merits of this that and the other thing. Try not to take it personally. Once you put something out on the forum there's no telling where it might go.

Jean
Reply With Quote
  #78   ^
Old Sun, Sep-11-16, 05:06
mccoy_3000's Avatar
mccoy_3000 mccoy_3000 is offline
Registered Member
Posts: 88
 
Plan: moderately LC, HF, LP
Stats: 149/143/143 Male 170
BF:
Progress: 100%
Default

Quote:
Originally Posted by mushymindy
Why was my post moved to the war zone? I didn't mean to cause any controversy, I just genuinely wanted some help


mushymind, also it didn't turn out to be a war at all, rather a useful exchange of ideas.

I'll take the opportunity to review my answer to your previous question.
Your ideal weight should perhaps be 57.5 kg, since you might have set a target with too low of a bodyfat percentage.
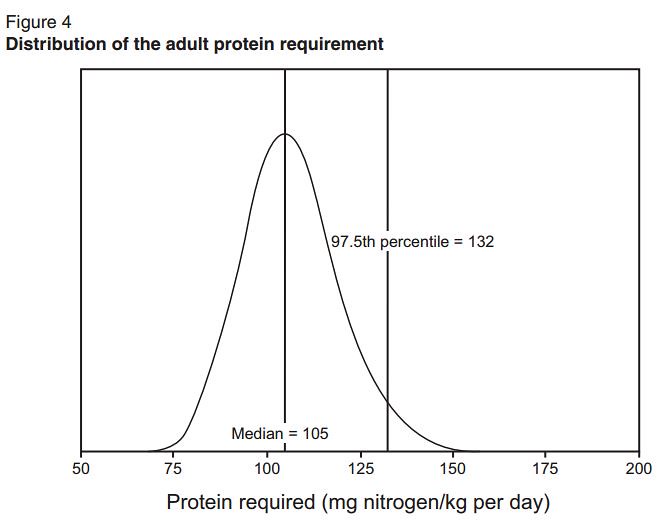
Following the WHO, 2002 (the most recent comprehensive official study I found yet on the issue) a reasonable strategy would be what I followed for myself.

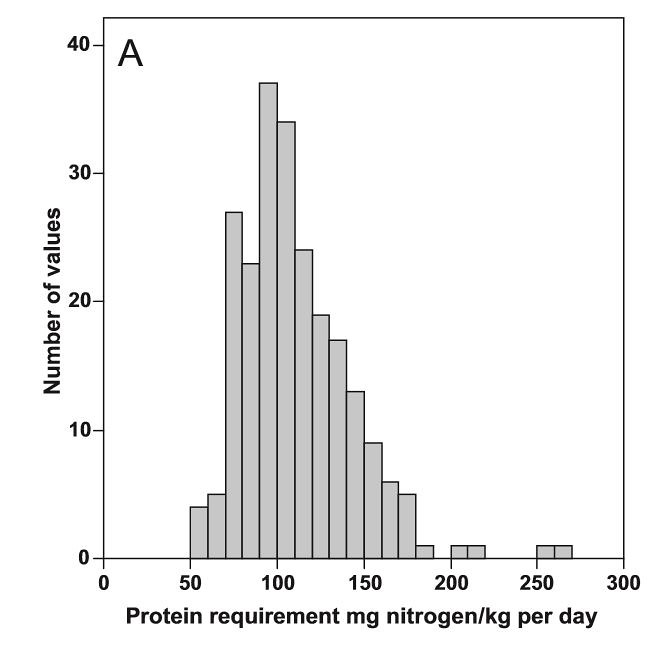
The modal (most frequent) requirement in the protein requirement PDF (probability density distribution) which WHO published is 100 mgN/kg = 0.63 g proteins/Kg, for all kinds of proteins. Pls note, the modal requirement < average requirement=0.66 since the distribution is skewed.

Since the answer to your question cannot be deterministic rather probabilistic, I'll give you 4 reference values:

More frequent Who,2002 value: 35 g proteins daily
Rosedale 0.75*kg value: 42 g proteins daily
Reasonable lower bound: 25 g
Reasonable uppper bound: 56 grams.

The complete, honest answer according to the WHO, 2002 study is that, with about 90% certainty, your minimum requirement will probably be something within the range of 25 to 56 grams of proteins.

You can add from 5 to 10 grams if you exercise according to the level of exercise.
The more reasonable choice, statistically speaking, would be to start at 35 grams (modal WHO requirement) and see what happens, then going upward or downward according to your own response.
The best response to monitor, according to Dr. Attia, a recognized expert on nutrition and blogger, is the change in muscle mass. If it decreases, you are starving and must consequently increase your daily intake of proteins until it's no more decreasing.
Reply With Quote
  #79   ^
Old Sun, Sep-11-16, 05:14
mccoy_3000's Avatar
mccoy_3000 mccoy_3000 is offline
Registered Member
Posts: 88
 
Plan: moderately LC, HF, LP
Stats: 149/143/143 Male 170
BF:
Progress: 100%
Default

Who's 2002 statistical distribution of protein requirement, chapter 7, figure 13, quantities in mg nitrogen per kg per day, n=235, mixed diets of animal and pant based proteins. Weights of individuals are compatible with ideal weight.

Reply With Quote
  #80   ^
Old Sun, Sep-11-16, 06:10
inflammabl's Avatar
inflammabl inflammabl is offline
Senior Member
Posts: 2,371
 
Plan: Atkins
Stats: 296/220/205 Male 71 inches
BF:25%?
Progress: 84%
Location: Upstate SC
Default

On the right hand side (RHS) are probably a couple of weight lifters then, inside of that, a couple of distance runners then, inside of that, a range of people who exercise to varying degrees. On the LHS are a few people who have oddly low protein requirements perhaps due to genetics, age or very sedentary lifestyles, i.e bed ridden.

The chart does it's job as a histogram to let people know that protein requirements are variable. Individual in nature. They are "scattered data" and should not be reduced to an average and variance then used to make policy. Of course the data could be approximated with some sort of Gamma distribution but an individually forced application of that idea would kill people. It helps to make people aware that an "n=1 experiment" is not really an experiment, we really do need to pay attention to our own needs and not generalize to others.
Reply With Quote
  #81   ^
Old Sun, Sep-11-16, 06:12
inflammabl's Avatar
inflammabl inflammabl is offline
Senior Member
Posts: 2,371
 
Plan: Atkins
Stats: 296/220/205 Male 71 inches
BF:25%?
Progress: 84%
Location: Upstate SC
Default

Quote:
Originally Posted by mushymindy
Why was my post moved to the war zone? I didn't mean to cause any controversy, I just genuinely wanted some help


I think my comment on protein requirements, varying carb limits in response to excess protein and an ultra low carb diet not being required caused it to be quarantined.
Reply With Quote
  #82   ^
Old Sun, Sep-11-16, 10:31
teaser's Avatar
teaser teaser is offline
Senior Member
Posts: 15,075
 
Plan: mostly milkfat
Stats: 190/152.4/154 Male 67inches
BF:
Progress: 104%
Location: Ontario
Default

I'd add habitual intake of protein to the list of variables, lower habitual protein intake will mean that it takes less dietary protein to maintain lean mass. The 64 000 dollar question is--at what point? I could be fairly muscular, cut my protein, lose 10 pounds of lean mass before hitting a muscle loss plateau--then go in and get tested, and by definition, the diet that brought me to my plateau contains the amount of protein needed to attain that plateau. Or, I could have never reached that muscular potential, due to a low long term habitual intake of protein, and have reached that plateau from the other direction.
Reply With Quote
  #83   ^
Old Sun, Sep-11-16, 13:05
mccoy_3000's Avatar
mccoy_3000 mccoy_3000 is offline
Registered Member
Posts: 88
 
Plan: moderately LC, HF, LP
Stats: 149/143/143 Male 170
BF:
Progress: 100%
Default

~ inflammable: the WHO study has used a lognormal distribution model, although a gamma model would do just the same, but the lognormal is more mathematically treatable.
I have some doubts about the extreme RHS tail. I'd probably treat them as outliers, errors in measurements, or unfiltered subpathological conditions.
If we delete from the dataset the 4 outliers we'll probably come out with a beta distribution. It would be interesting to re examine the database if we had the original dataset. The elimination of the outliers would not influence of course the modal value. This is the lognormal model adopted by the WHO study.
Median requirement = 0.66 grams kg-1 d-1
Parametric 97.5 % ile = 0.83 grams kg-1 d-1


Last edited by mccoy_3000 : Sun, Sep-11-16 at 13:40.
Reply With Quote
  #84   ^
Old Sun, Sep-11-16, 13:36
mccoy_3000's Avatar
mccoy_3000 mccoy_3000 is offline
Registered Member
Posts: 88
 
Plan: moderately LC, HF, LP
Stats: 149/143/143 Male 170
BF:
Progress: 100%
Default

Quote:
Originally Posted by teaser
I'd add habitual intake of protein to the list of variables, lower habitual protein intake will mean that it takes less dietary protein to maintain lean mass. T


That would be the homeostatic adjustment or intra-individual variability due to adaptation. The issue is described in the WHO study and it is just cited that it is an added source of variability.
Reply With Quote
  #85   ^
Old Sun, Sep-11-16, 13:40
inflammabl's Avatar
inflammabl inflammabl is offline
Senior Member
Posts: 2,371
 
Plan: Atkins
Stats: 296/220/205 Male 71 inches
BF:25%?
Progress: 84%
Location: Upstate SC
Default

Quote:
lognormal distribution model... gamma model... beta distribution

It could be all of those. Since you have some background, my underlining point was that the distribution of the data seems statistical and is amenable to tricks using the central limit theorem. In other words, prone to over simplification and misapplication. That's kind of the point about the four n's on the RHS, right? If they are outliers or special cases then they would be harmed by some policy maker who said, "Fact: People have a protein need of 90mg of N/kg of body weight."
Reply With Quote
  #86   ^
Old Sun, Sep-11-16, 13:51
mccoy_3000's Avatar
mccoy_3000 mccoy_3000 is offline
Registered Member
Posts: 88
 
Plan: moderately LC, HF, LP
Stats: 149/143/143 Male 170
BF:
Progress: 100%
Default

Quote:
Originally Posted by inflammabl
It could be all of those. Since you have some background, my underlining point was that the distribution of the data seems statistical and is amenable to tricks using the central limit theorem. In other words, prone to over simplification and misapplication. That's kind of the point about the four n's on the RHS, right? If they are outliers or special cases then they would be harmed by some policy maker who said, "Fact: People have a protein need of 90mg of N/kg of body weight."


Inflammable, yes, I've been into quantitative risk evaluation and statistical data analysis.
What you say is a legitimate concern, although the WHO publication very clearly defines the probabilistic nature of the minimum protein requirement and the individual variability. For example, they correctly used the median and not the average of the sample distribution, since the outliers would have inflated the number, in a misleading way. That's sort of what politician do (at least, they used to do that years ago) when adopting a pro capita income of the citizens. They use an average income. The data is not false by itself, but includes the outliers such as Bill Gates, Warren Buffet, and is not representative of the median income, which rules out the extremely rich people, who are a world on their own.

One interesting outcome of the parametric (lognormal) analysis is that the value of 1.0 grams -kg-d is the 99.9th percentile, so it means that, if we take 1 grams/kg daily of proteins, nobody will be in negative nitrogen balance, that is it will be more than enough for everyone.

1 grams/kg daily of proteins is the upper bound of requirements in the WHO study.
Reply With Quote
  #87   ^
Old Sun, Sep-11-16, 14:16
teaser's Avatar
teaser teaser is offline
Senior Member
Posts: 15,075
 
Plan: mostly milkfat
Stats: 190/152.4/154 Male 67inches
BF:
Progress: 104%
Location: Ontario
Default

Okay... grams of protein per gram of nitrogen comes to something like 6.25 if I remember correctly.

If you call it 100 mg per kilogram of body weight...

Then that comes to 625 mg of protein per kilogram of body weight, which would give you .625 grams of protein per kilogram of body weight. Pretty close to the .6 minimum we've been talking about.

http://apps.who.int/iris/bitstream/...TRS_935_eng.pdf

And by the WHO paper, that gives you about a 50/50 chance of that being an adequate protein intake. If that were a generalized, unqualified recommendation, it would be no wonder that we're in the War Zone.

Quote:
The complete, honest answer according to the WHO, 2002 study is that, with about 90% certainty, your minimum requirement will probably be something within the range of 25 to 56 grams of proteins.


No. The complete honest answer is that with about 90 percent certainty, 56 grams of protein, in the context of a mixed diet, as would be used in standard nitrogen balance studies, will be at or above your minimum requirement.

If we're talking a 70 kilogram man that would be about 122 mg nitrogen/kilogram on table 1, it says 90 percent certainty that the requirement's met. Going from 56 to 25 grams of protein, looking at the table--the number doesn't go down lower than 72 mg, at that point a probability of sufficiency of .1 percent is given. I don't understand your rationale in assigning a probability to the range in this manner.
Reply With Quote
  #88   ^
Old Sun, Sep-11-16, 14:55
mccoy_3000's Avatar
mccoy_3000 mccoy_3000 is offline
Registered Member
Posts: 88
 
Plan: moderately LC, HF, LP
Stats: 149/143/143 Male 170
BF:
Progress: 100%
Default

Quote:
Originally Posted by teaser

No. The complete honest answer is that with about 90 percent certainty, 56 grams of protein, in the context of a mixed diet, as would be used in standard nitrogen balance studies, will be at or above your minimum requirement.
If we're talking a 70 kilogram man that would be about 122 mg nitrogen/kilogram on table 1, it says 90 percent certainty that the requirement's met. Going from 56 to 25 grams of protein, looking at the table--the number doesn't go down lower than 72 mg, at that point a probability of sufficiency of .1 percent is given. I don't understand your rationale in assigning a probability to the range in this manner.


Teaser, my rationale is based upon a quick look at the non-parametric distribution (the hystogram) sans outliers and estimating approximate percentiles from it.
The WHo figures are based upon parametric (lognormal distribution) calculations and various assumptions on variability or standard deviation of distribution. Also, my affirmation is based considering both tails (area under the curve of the range: 25 to 56), what you say is about considering the overlap of distribution in one tail, being in thechnical terms a reliability estimate (area under the intersected tail. But I'm goign to see that part again. Also, my approximation might be wrong since was a quick estimate.
I'm going to review that and back here.
Reply With Quote
  #89   ^
Old Sun, Sep-11-16, 15:00
mccoy_3000's Avatar
mccoy_3000 mccoy_3000 is offline
Registered Member
Posts: 88
 
Plan: moderately LC, HF, LP
Stats: 149/143/143 Male 170
BF:
Progress: 100%
Default

~ teaser: on the mixed diet. According to WHO, a lipid energy substrate has the same effect, or even more efficient, than a glucose energy substrate. They cite some studies, but sure enough we don't know which kind of diet those samples followed or if the carbs were very low as in LC-keto diets.
Bottom line non-technical: the quality of fuel, carb or fat, would not be relevant to the proteins requirement. With some legitimate doubts.

Quote:
At very low levels of either protein or energy intakes, the protein-sparing
effect of carbohydrates is greater than that of lipids (20), and it has been
proposed that this is also true as energy intakes increase towards maintenance
(21). However, more recent work suggests that lipids become as
effective as or even more effective than carbohydrates in the maintenance
range (22, 23). In the clinical environment, most studies show an equivalent
nitrogen-sparing effect of glucose or lipids during total parenteral nutrition
in adults and children, with a lipid–glucose regimen sparing more nitrogen
than glucose alone, and with medium-chain triglycerides being particularly
effective in promoting nitrogen balance. Furthermore, high-fat regimes have
been developed to ensure rapid weight gain and very efficient nitrogen
utilization in children given an energy-dense, high-fat diet with a fat:carbohydrate
ratio of up to 4:1 (22, 23).
Reply With Quote
  #90   ^
Old Sun, Sep-11-16, 15:23
teaser's Avatar
teaser teaser is offline
Senior Member
Posts: 15,075
 
Plan: mostly milkfat
Stats: 190/152.4/154 Male 67inches
BF:
Progress: 104%
Location: Ontario
Default

Quote:
Originally Posted by mccoy_3000
Teaser, my rationale is based upon a quick look at the non-parametric distribution (the hystogram) sans outliers and estimating approximate percentiles from it.
The WHo figures are based upon parametric (lognormal distribution) calculations and various assumptions on variability or standard deviation of distribution. Also, my affirmation is based considering both tails (area under the curve of the range: 25 to 56), what you say is about considering the overlap of distribution in one tail, being in thechnical terms a reliability estimate (area under the intersected tail. But I'm goign to see that part again. Also, my approximation might be wrong since was a quick estimate.
I'm going to review that and back here.


That's fine. Not that I understand all the language here.

But I doubt that 25 grams of protein would be sufficient for 90 percent of the population. Maybe you could satisfy the requirements of 90 percent of the population with a range of 25-56 grams per day, but there'd be more risk for anybody taking in protein at the lower end of the range.
Reply With Quote
Reply


Posting Rules
You may not post new threads
You may not post replies
You may not post attachments
You may not edit your posts

vB code is On
Smilies are On
[IMG] code is On
HTML code is Off


All times are GMT -6. The time now is 17:01.


Copyright © 2000-2024 Active Low-Carber Forums @ forum.lowcarber.org
Powered by: vBulletin, Copyright ©2000 - 2024, Jelsoft Enterprises Ltd.